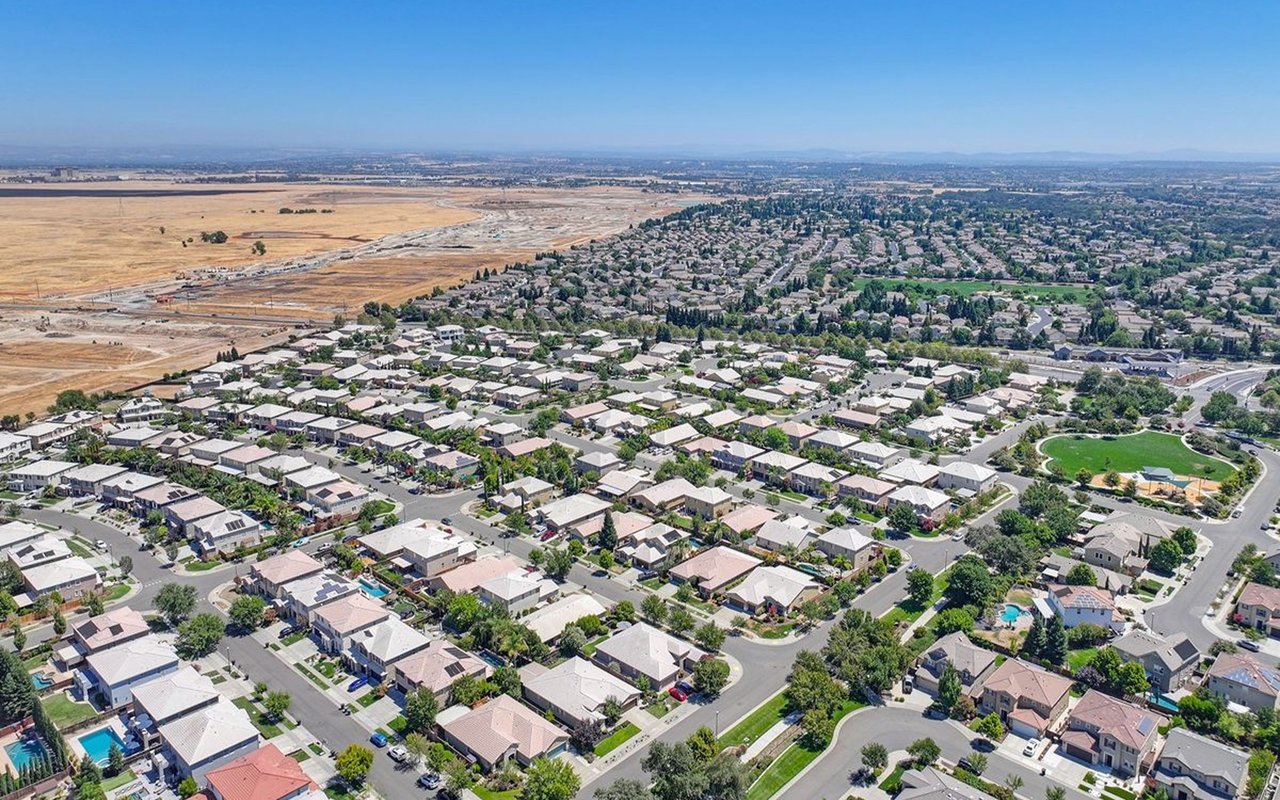
Roseville Neighborhoods: Cheaper Per Square Foot, Bigger Tax Bill
In Roseville, the neighborhoods with the lowest price per square foot are the newest ones, and they are also the ones most likely to carry a Mello-Roos special tax. Buyers who compare Roseville neighborhoods on list price alone end up sorting them almost backwards, because the cheaper-per-foot house often costs more to hold every year. This post compares Roseville's areas on price per square foot, lot size, home age and CFD exposure, and shows you where the school district lines actually fall.
If you're trying to pick a Roseville neighborhood right now, you've probably noticed that the numbers don't line up the way you expected. The new stuff out west looks like a better deal per square foot than the older stuff off Cirby, and nobody can quite tell you why that is, or what it costs you later.
The short version:
- Roseville's citywide median sale price is $637,745 at $333 per square foot, with a median year built of 1998 and a median lot of 6,534 square feet, per Homes.com trailing twelve months, retrieved August 2026.
- Campus Oaks, the newest neighborhood in the comparison at a 2023 median year built, has the lowest price per square foot in the city at $285.
- Maidu and Roseville Heights, with median year built of 1984 and 1976, have the highest at $381.
- Nearly every named neighborhood in north and west Roseville sits inside a Community Facilities District. Most of the older core does not.
- Five separate school districts serve addresses inside Roseville city limits, and the high school district's boundaries change for the 2027 to 2028 school year.
The Newest Roseville Neighborhoods Cost the Least Per Square Foot
This is the part that surprises people.
Newer construction in Roseville is not more expensive per foot. It is less expensive per foot, and it is bigger. Campus Oaks sits at $285 per square foot on a 2023 median year built and a 2,469 square foot typical home. Maidu, built around 1984, runs $381 per square foot on a 2,042 square foot typical home. You're paying more per foot for the older house and getting fewer feet.
All figures below come from Homes.com, trailing twelve months, retrieved August 2026. I've used one source and one method on purpose. Zillow, Redfin and Realtor.com each measure differently and each would produce a different table.
Neighborhood | Median sale price | Per sq ft | Median yr built | Median lot (sq ft) | Sales, 12 mo |
|---|---|---|---|---|---|
Morgan Creek Village | $1,155,000 | $314 | 2005 | 19,602 | 22 |
Stoneridge | $877,000 | $357 | 2004 | 8,276 | 83 |
Campus Oaks | $792,277 | $285 | 2023 | 5,662 | 28 |
Diamond Oaks | $735,000 | $330 | 1989 | 8,712 | 63 |
Maidu | $729,000 | $381 | 1984 | 8,712 | 28 |
Fiddyment Farm | $700,000 | $328 | 2012 | 6,098 | 161 |
Woodcreek Oaks | $654,000 | $357 | 1997 | 6,969 | 31 |
Blue Oaks | $643,450 | $315 | 2004 | 6,969 | 116 |
Highland Reserve | $627,000 | $346 | 1999 | 6,098 | 52 |
Sun City (55+) | $585,000 | $364 | 1997 | 6,969 | 189 |
Roseville Heights | $505,250 | $381 | 1976 | 5,662 | 78 |
Read the last column before you read any of the others. Morgan Creek Village, Campus Oaks, Maidu and Woodcreek Oaks each closed roughly thirty sales or fewer in twelve months. A median built on that few transactions moves hard on one unusual sale, so treat those four rows as direction rather than precision.
Lot size is where the real separation happens. Morgan Creek Village sits at a 19,602 square foot median, roughly 0.45 acres, which is about three times the citywide median. Everything else in the table clusters between 5,662 and 8,712 square feet. If lot is what you're after in Roseville, the list is short.
Per square foot, Roseville is a narrow market. Per parcel, it isn't.
For context outside the city line, the California Association of Realtors put the July 2026 median sold price for existing single-family homes in Placer County at $689,000. That's county-level and includes Granite Bay, Loomis and the foothills, so it sits above any Roseville figure here.
Almost Every West Roseville Neighborhood Sits in a CFD. Most of Old Roseville Doesn't.
Here's where the cheaper-per-foot house gets expensive.
Placer County publishes a list of every direct charge that can appear on a property tax bill, and the FY 2025/26 roll carries more than forty separate City of Roseville Community Facilities Districts. Fiddyment Ranch, Westpark, Westbrook, Campus Oaks, Creekview, Highland Reserve, Stoneridge, Diamond Creek, Crocker Ranch, Amoruso Ranch, Stone Point, Wood Creek and the Sierra Vista sub-districts all appear. Cirby, Royer Park, Old Roseville and the historic core do not appear anywhere on it.
The City of Roseville's finance department puts the mechanics plainly:
"CFD special taxes are typically collected on your general property tax bill with payments due on December 10th and April 10th of each year."
What that costs depends entirely on the district. Fiddyment Ranch CFD No. 5, per its Series 2021 bond official statement, set a maximum annual special tax of $1,901.86 per low-density residential unit for fiscal year 2021 to 2022, escalating two percent a year. Villages at Sierra Vista CFD No. 1 set $1,800.00 per low-density unit in its base year of 2018 to 2019.
Read those as ceilings, not bills. They're maximum rates from a base year, and the actual levy on a given parcel in a given year can be lower. There is no published "average Roseville Mello-Roos payment," and anyone who quotes you one is estimating.
Now the correction almost nobody makes. A line item on your tax bill is not automatically Mello-Roos. Older Roseville parcels frequently carry a Landscape and Lighting District charge instead, and the FY 2025/26 roll lists several: Historic District, Vernon Streetscape, Riverside Avenue, Infill, North Central. Those are assessments, not CFD special taxes, and they're typically far smaller. I've watched buyers see a direct charge on an older Roseville bill and assume they'd found Mello-Roos where none exists.
One more caution before you write off the older side of town entirely. The roll also includes a City of Roseville Public Services CFD No. 4, which the City's own document library names the Infill Services District. An infill district can attach to newly built parcels inside already-developed parts of the city. So a recent infill build on an older street can carry a CFD charge that its 1968 neighbor does not.
Exposure tracks when the parcel was entitled, not what ZIP code it's in. If you want the longer treatment of how this works across the county, I wrote it up in Mello-Roos in Placer County: What Every Buyer Needs to Know.
Five School Districts Serve Roseville, Not One
Most buyers assume a Roseville address means the Roseville school district. It doesn't, necessarily.
The City of Roseville states it directly:
"Five school districts serve residents in the City of Roseville. It's important to note that in California, school districts do not report to cities."
Those five are Roseville City School District (TK-8), Dry Creek Joint Elementary (TK-8), Eureka Union (K-8), Center Unified (TK-12), and Roseville Joint Union High School District (9-12). Per the City's General Plan, Roseville Joint Union serves the majority of the planning area, Eureka Union serves a small area in the eastern portion, and Center Unified serves portions of the southwest. So a Roseville buyer can land in three different K-8 districts and still feed the same high school district.
Published figures, so you can look rather than take an adjective from me. Percent standard met or exceeded, California Department of Education CAASPP results, 2024-25 test year:
District | ELA | Math |
|---|---|---|
Eureka Union | 74.59% | 70.40% |
Roseville Joint Union High (grade 11) | 63.79% | 41.61% |
Roseville City | 59.05% | 51.25% |
Dry Creek Joint Elementary | 54.25% | 45.32% |
Center Joint Unified | 37.85% | 25.68% |
Elementary districts test grades three through eight; the high school district tests grade eleven only, so those rows aren't measuring the same thing. Niche's 2026 rankings put Roseville Joint Union High at an A+ and 39th in California, Eureka Union at an A, Dry Creek at a B+, and Roseville City and Center Joint Unified at a B.
None of that tells you which district a specific house is in. Eureka Union says so in one sentence:
"School attendance boundaries are determined by your address."
There's no single citywide lookup. Each district runs its own address locator, which is itself the clearest evidence that city limits and district lines are different things. And this is a moving target right now: Roseville Joint Union's board approved a new attendance boundary map on May 18, 2026, effective for the 2027 to 2028 school year, and Roseville City School District has announced its own boundary adjustment process. Confirm the attendance boundary for the specific address, in the current year, with the district itself. Do not rely on a listing sheet.
The Five Numbers to Check Before You Write an Offer (Save This)
Five numbers separate a Roseville house that pencils from one that doesn't.
1. Price per square foot, not price. Run it on every home you're comparing. A $700,000 house at $285 per foot and a $700,000 house at $381 per foot are not the same purchase.
2. The lot, in square feet, from the parcel record. Not the listing's adjective. Roseville's citywide median is 6,534 square feet, so anything meaningfully above that is genuinely unusual here.
3. The CFD line on the actual tax bill. Pull the parcel, not the city average. Start with the City of Roseville property information tool to get the APN, then take that APN to the Placer County Treasurer-Tax Collector's property tax search. Or send me the address and I'll run the Placer Parcel Check and send it back to you: the actual tax bill, the CFD and special assessment detail, and any HOA documents, before you write anything.
4. The district assignment, confirmed at the district's own locator. For the current year and, if it matters to you, for 2027 to 2028.
5. The year the parcel was entitled, not just the year the house was built. That's what predicts CFD exposure, and it's why two houses on the same street can carry different charges.
If you want a level backyard over a quarter acre, the search narrows to Morgan Creek Village and pockets of Diamond Oaks, Maidu and Stoneridge. If you want the most house for the fewest dollars per foot, you're looking north and west, and you should assume a special tax until the bill proves otherwise. If you want no CFD charge at all, you're looking at the older core, and you're trading square footage and a newer roof for it.
Three Mistakes I See Roseville Buyers Make
1. Comparing list prices across neighborhoods without normalizing to square footage. It makes the newest inventory look expensive when per foot it's the cheapest thing in the city.
2. Treating "Roseville" as one school district. It's five, the lines don't follow the city limits, and the high school lines are changing for 2027 to 2028.
3. Budgeting the mortgage and stopping. The special tax, the HOA where there is one, and the assessment district charge are all annual, and none of them show up in the listing price.
Why This One Is Worth an Hour With Someone Who Pulls Tax Bills
Roseville is the market where the public data is most likely to mislead you.
The aggregators publish a city median. Roseville doesn't really have one worth acting on, because a 1976 house off Cirby and a 2023 house in Campus Oaks are different products with different carrying costs and different district assignments, and the average of the two describes neither. I pull the actual tax bill on every property before my buyers write an offer, because the direct-charge section is where the difference lives and it is the one number no listing tells you.
Over 35 years in this county, and I still check the parcel every time. The lines move.
If you'd like to read what past clients have said about working with me, you can find reviews on Google and Zillow.
How I'd Decide
The Roseville buyers who do well are the ones who priced the tax bill before they fell for the kitchen.
Pick your two or three neighborhoods off the table above on lot size and price per foot, because those are the attributes that don't change. Then pull the tax bill and the district assignment on every specific address before you get attached to one. You'll know what the parcel actually costs to hold, which district your address feeds this year and next, and whether the price per foot you're paying is buying you square footage or just a newer build date.
Choose the parcel. The city is just the mailing address.
If you want, I'll run the Placer Parcel Check on a specific Roseville address before you write anything. Let's connect and I'll pull it.
For newer Roseville inventory specifically, the Placer One Roseville Luxury Living Guide covers the master plan going in on the city's western edge. And if you're weighing Roseville against Rocklin, the Whitney Oaks vs Stanford Ranch comparison runs the same exercise one city over.
Frequently Asked Questions
Which Roseville neighborhood has the largest lots?
Of the neighborhoods in this comparison, Morgan Creek Village has the largest median lot at 19,602 square feet, roughly 0.45 acres, per Homes.com trailing twelve months as of August 2026. Diamond Oaks and Maidu follow at 8,712 square feet. Roseville's citywide median lot is 6,534 square feet.
Does Roseville have Mello-Roos?
Yes, on many parcels. The Placer County FY 2025/26 direct-charge roll lists more than forty City of Roseville Community Facilities Districts, concentrated in north and west Roseville. Older central and east Roseville generally does not appear, though newer infill construction there can. Check the specific parcel's tax bill.
Why do newer Roseville homes cost less per square foot?
Newer Roseville neighborhoods deliver larger homes on smaller lots, which lowers the price per square foot even as the total price rises. Campus Oaks, with a 2023 median year built, runs $285 per square foot. Roseville Heights, at a 1976 median, runs $381, per Homes.com as of August 2026.
How many school districts serve Roseville, CA?
Five. Per the City of Roseville, they are Roseville City School District, Dry Creek Joint Elementary, Eureka Union, Center Unified, and Roseville Joint Union High School District. Attendance boundaries are set by address, not by city limits, so confirm the assignment for the specific property with the district.
Are Roseville school boundaries changing?
Yes. Roseville Joint Union High School District's board approved a new attendance boundary map on May 18, 2026, taking effect for the 2027 to 2028 school year, and Roseville City School District has announced a boundary adjustment process of its own. Confirm current and upcoming assignments directly with each district.
Sources: County of Placer Direct Charges on the 2025/26 Property Tax Roll; City of Roseville, Special Taxes and Assessments; City of Roseville, Know Your Boundaries; Eureka Union School District, School Boundaries; Roseville Joint Union High School District, Attendance Boundary; California Department of Education, CAASPP results; C.A.R. County Sales Activity; Homes.com Roseville local guide; Placer County Treasurer-Tax Collector property tax search.
About the Author
Parris Krygsman is a Placer County real estate agent with over 35 years of experience, licensed since 1991, $700 million in closed sales, and a consistent ranking in the top 3% of Coldwell Banker agents in the Sac-Tahoe Region. He serves buyers and sellers across Roseville, Rocklin, Granite Bay, Loomis, Auburn, Lincoln, Penryn, and Sacramento. His listings sell between 98 and 100 percent of list price, backed by data-driven pricing, MLS-verified market analysis, and negotiation skills sharpened across hundreds of transactions. He works with first-time buyers, move-up buyers, VA clients, luxury sellers, relocation clients, and investors in vacant land and income properties.
Coldwell Banker Realty · Roseville and Placer County, CA · 530-798-3400 · CalDRE#01122830
Equal Housing Opportunity. Parris Krygsman, CalDRE#01122830 | NRT West, INC, CalDRE#01908304, regulated by the California Department of Real Estate. This article is general information only and does not constitute legal, tax, or financial advice. Market figures are as of the dates and sources named in the text and will change. Confirm your specific costs, disclosures, school assignments, and contract terms with your attorney, tax advisor, lender, escrow officer, and the relevant school district.